Module 3: AI and Data Analytics tackles the most intimidating frontier for many coaches: the world of algorithms and big data. In an age where every pass, step, and heartbeat generates a number, this module addresses the “analysis paralysis” that plagues modern sports management. Rather than drowning coaches in coding or complex statistics, the module adopts a narrative-driven learning approach. By following the story of “Coach Leo,” the training demystifies these buzzwords, proving that AI is not a sci-fi replacement for human intuition, but a tireless “smart assistant” that works behind the scenes.
The module is structured to guide the learner through the transition from raw noise to actionable signal, identifying specific clarity points at each stage:
1. The Scenario: The Noise and The Blind Spot
The story begins with Coach Leo, who is diligent but overwhelmed. He collects fitness test scores, game stats, and attendance records, but they live in disparate notebooks and messy spreadsheets.
- The Trigger: Leo feels his team is “off” during mid-week games but can’t pinpoint why. Is it fatigue? Strategy? Morale?
- The Constraint: He attempts to look through weeks of paper records to find a pattern, but the manual effort is too high. He gives up, forced to rely on guesswork to adjust the lineup.
- The Risk: Without a clear view, Leo misses a critical trend: his star players are consistently underperforming 48 hours after heavy conditioning drills.
2. The Application: The Lighthouse Effect
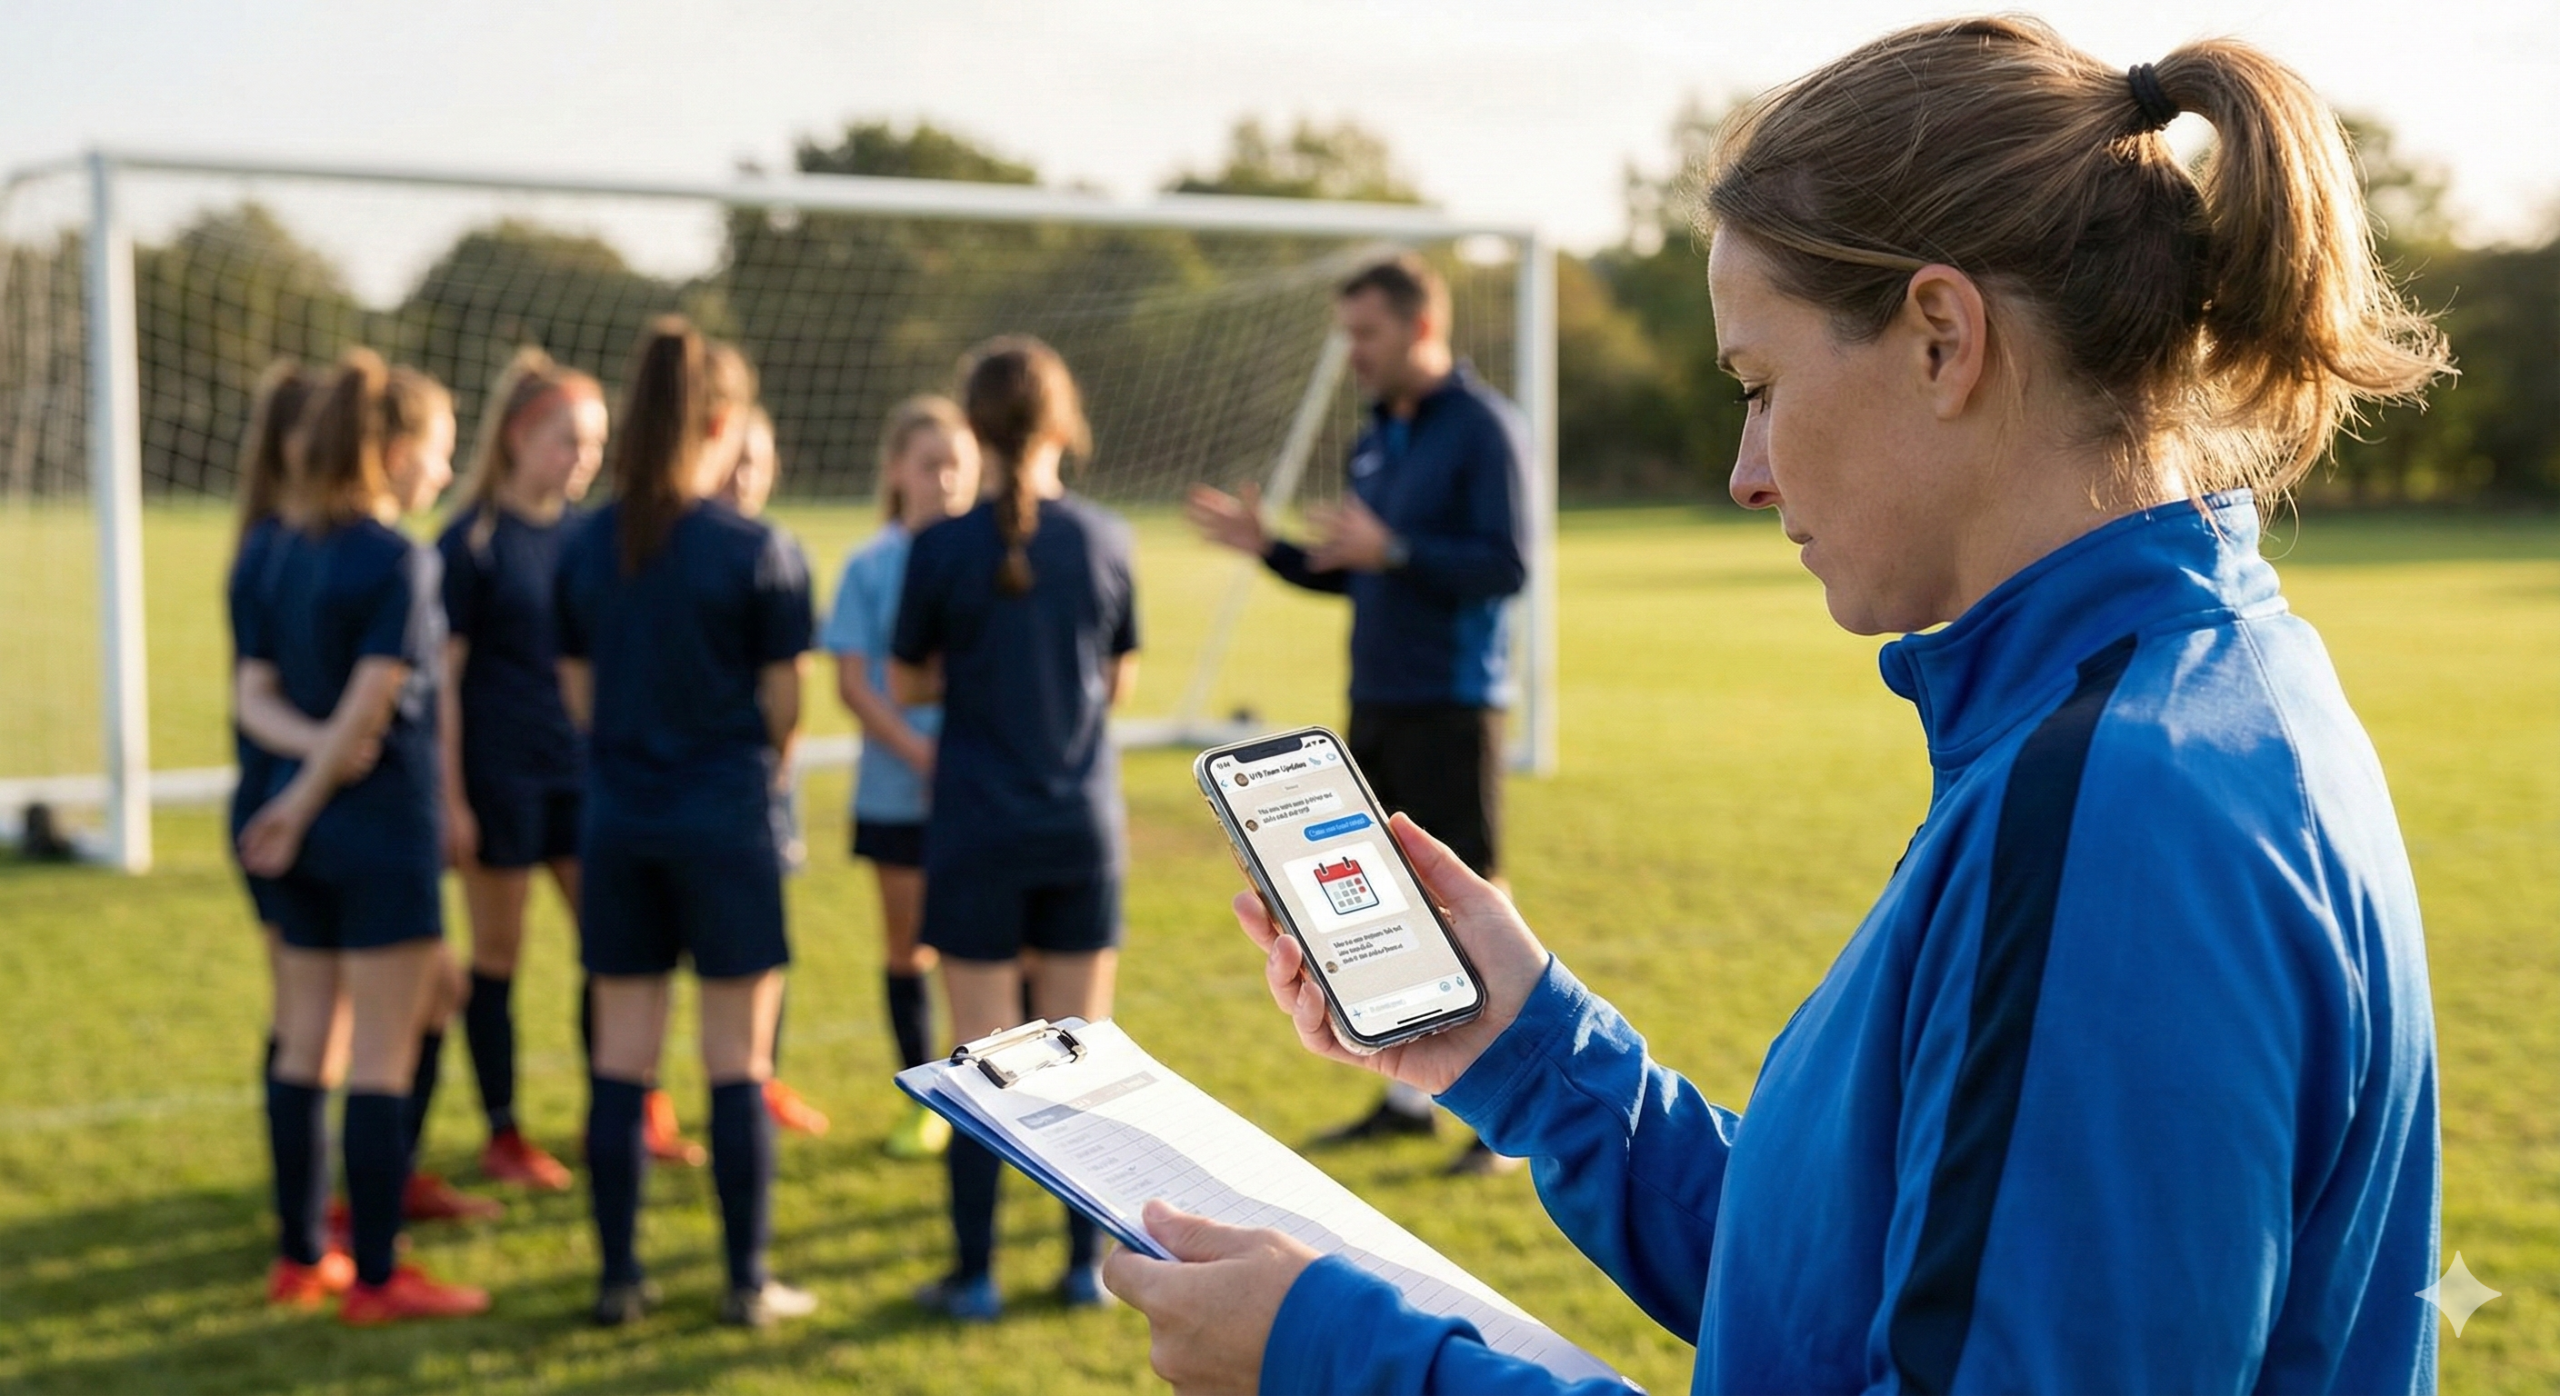
Leo decides to apply the Novice Level principles from FutureCoach. He inputs his key stats (goals, sprint times) into a simple analytics app with basic AI features.
- The Action: Instead of calculating averages manually, he lets the software process the numbers. He treats the AI like a “co-coach” who handles the repetitive math.
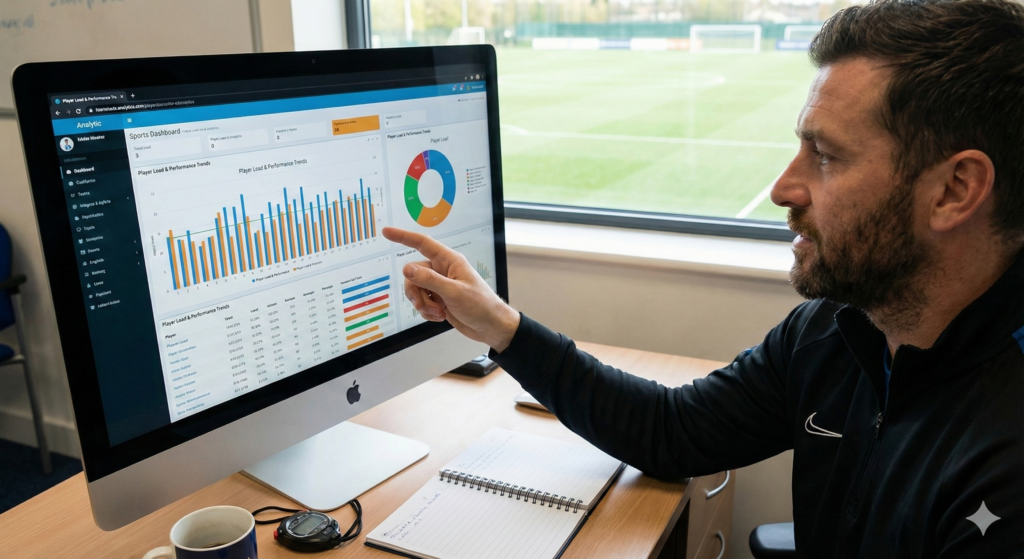
- The Insight: The app visualizes the data instantly. It highlights a red flag: “Average sprint speed drops 15% on Tuesdays.”
- The Reality: The data acts as a lighthouse. It illuminates a pattern Leo couldn’t see because he was too close to the daily grind. The AI didn’t make the decision; it just cleaned the windshield so Leo could see the road.
3. The Outcome: Predictive Precision
The consequences of this insight are strategic and immediate.
- Tactical Adjustment: Leo shifts the heavy conditioning to earlier in the week. The “Tuesday Slump” disappears, and game performance stabilizes.
- Intermediate Integration: Encouraged, Leo moves to the next level. He integrates heart-rate data (from Module 1) with game stats into a single dashboard. Now, he isn’t just reacting; he is monitoring “Load,” ensuring players don’t exceed safe limits.
- Elite Horizon: He begins to understand the Elite potential—using predictive modeling to run simulations, asking, “What happens to our injury risk if we increase training intensity by 10%?”
Why This Matters
This module goes beyond spreadsheets to analyze why data integration creates a “razor-sharp competitive edge.” It emphasizes that AI and Data Analytics are helpers, not masters. As the FUTURECOACH research highlights, the goal is to bridge the gap between raw data and smarter coaching decisions. Whether you are a novice using a mobile app to track goal averages, or an elite coach using algorithms to predict injury risk based on genetic markers and sleep logs, the principle is the same: these tools allow you to justify training adjustments with objective evidence rather than gut feeling.
Comprehensive Implementation Checklist
To prevent the common pitfall of “Analysis Paralysis,” participants are provided with an actionable checklist to turn numbers into strategy.
Step 1: Simplify the Input (The Novice Start)
- Don’t Fear the Buzzwords: Remember that “AI” is just a program that learns from data. Treat it as a tool, not a threat.
- Pick One Metric: Start by tracking one clear stat (e.g., Goals Scored or Sprint Times) in a basic app or spreadsheet.
- Automate the Math: Use tools that automatically average scores or plot progress charts. Don’t do the heavy lifting manually.
Step 2: Integrate and Visualize (The Intermediate Step)
- Centralize the Data: Bring your streams together. Try to view fitness scores and game stats in one place (a simple dashboard) to see the “big picture.”
- Visualize the Trend: Use graphs instead of rows of numbers. It is easier to spot a “dip” in a line chart than in a column of text.
- Check the Workload: Use analytics to flag if a player’s workload exceeds safe limits (Load Monitoring).
Step 3: Interpret and Act (The Decision)
- Ask the “So What?” Question: When looking at data, always ask: “What does this tell me to change?” If the data doesn’t lead to an action, it’s just noise.
- Verify with Intuition: AI is the co-coach, but you are the Head Coach. If a result looks surprising, verify it with your own judgment before making drastic changes.
By mastering these steps, coaches transform from data-gatherers into true strategists, using the past to predict—and win—the future.